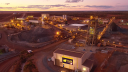
29Metals
29M.AX29Metals Limited Price (29M.AX)
Stock Price
Market Cap
Fetching Data...
Enterprise Value
Fetching Data...
Volume
Fetching Data...
Shares Outstanding
551,538,945
(11.7577)%Income Statement Summary
| Revenue | |
| Cost of Revenue | |
| Gross Profit | |
| Operating Expenses | |
| Operating Income | |
| Other Expenses | |
| Net Income |
Income Statement
29Metals LimitedCurrency: AUD
| YEAR | 2018 | 2019 | 2020 | 2021 | 2022 | 2023 | |||||||||||||
|---|---|---|---|---|---|---|---|---|---|---|---|---|---|---|---|---|---|---|---|
| Revenue | |||||||||||||||||||
| Revenue |
524.91M
+0% |
657.17M
+25% |
434.45M
-34% |
593.85M
+37% |
714.01M
+20% |
453.88M
-36% |
|||||||||||||
| Cost of Revenue | |||||||||||||||||||
| Cost of Revenue | 428.56M | 499.42M | 327.16M | 364.01M | 527.81M | 548.47M | |||||||||||||
| Gross Profit | |||||||||||||||||||
| Gross Profit |
96.35M
+0% |
157.75M
+64% |
107.30M
-32% |
229.85M
+114% |
186.20M
-19% |
-94,597,000.00
-151% |
|||||||||||||
| Gross Profit Ratio | (0.18%) | (0.24%) | (0.25%) | (0.39%) | (0.26%) | (-0.21%) | |||||||||||||
| Operating Expenses | |||||||||||||||||||
| Research and Development | 0.00 | 0.00 | 0.00 | 0.00 | 0.00 | 0.00 | |||||||||||||
| General and Administrative | 18.72M | 19.16M | 4.69M | 18.63M | 33.47M | 34.29M | |||||||||||||
| Selling, General & Admin... | 18.72M | 19.16M | 8.68M | 18.63M | 33.47M | 139.83M | |||||||||||||
| Selling & Marketing Exp... | 0.00 | 0.00 | 3.99M | 0.00 | 0.00 | 105.54M | |||||||||||||
| Depreciation and Amortiz... | 100.18M | 114.95M | 57.47M | 102.66M | 194.11M | 124.46M | |||||||||||||
| Other Expenses | 0.00 | 0.00 | 0.00 | 119.34M | 189.40M | 122.11M | |||||||||||||
| Total Operating Expenses | 18.72M | 19.16M | 8.68M | 137.97M | 222.87M | 261.94M | |||||||||||||
| Cost and Exponses | 447.28M | 518.59M | 335.83M | 501.97M | 750.68M | 802.80M | |||||||||||||
| Operating Income | |||||||||||||||||||
| Operating Income |
77.63M
+0% |
138.59M
+79% |
98.62M
-29% |
46.88M
-52% |
-46,972,000.00
-200% |
-353,055,000.00
+652% |
|||||||||||||
| Operating Income Ratio | (0.15%) | (0.21%) | (0.23%) | (0.08%) | (-0.07%) | (-0.78%) | |||||||||||||
| Other Income and Exp... | |||||||||||||||||||
| Interest Income | 19.19M | 1.76M | 287.00k | 90.00k | 1.39M | 5.23M | |||||||||||||
| Interest Expenses | 0.00 | 15.50M | 96.65M | 29.10M | 18.84M | 30.85M | |||||||||||||
| Total Other Income/Exp... | -44,950,000.00 | -21,819,000.00 | -64,105,000.00 | -29,099,000.00 | -18,844,000.00 | -29,336,000.00 | |||||||||||||
| EBITDA | |||||||||||||||||||
| EBITDA | 174.62M | 248.67M | 188.63M | 147.18M | 144.14M | -230,926,000.00 | |||||||||||||
| EBITDA ratio | (0.34%) | (0.39%) | (0.36%) | (0.25%) | (0.20%) | (-0.51%) | |||||||||||||
| Income Before Tax | |||||||||||||||||||
| Income Before Tax | 32.68M | 116.77M | 34.51M | 17.78M | -65,816,000.00 | -382,391,000.00 | |||||||||||||
| Income Before Tax Ratio | (0.06%) | (0.18%) | (0.08%) | (0.03%) | (-0.09%) | (-0.84%) | |||||||||||||
| Income Tax Expense | |||||||||||||||||||
| Income Tax Expense | 14.58M | 35.02M | 34.51M | -103,236,000.00 | -18,594,000.00 | 58.07M | |||||||||||||
| Net Income | |||||||||||||||||||
| Net Income | 18.10M
+0% |
81.74M
+352% |
0.00
+0% |
121.01M
+0% |
-47,222,000.00
-139% |
-440,463,000.00
+833% |
|||||||||||||
| Net Income Ratio | (0.03%) | (0.12%) | (0.00%) | (0.20%) | (-0.07%) | (-0.97%) | |||||||||||||
| Earning Per Share | |||||||||||||||||||
| Basic EPS | 0.04 | 0.17 | 0.00 | 0.47 | -0.10 | -0.80 | |||||||||||||
| Diluted EPS | 0.04 | 0.17 | 0.00 | 0.47 | -0.10 | -0.80 | |||||||||||||
| Share Outstanding | |||||||||||||||||||
| Basic Share Outstanding | 492.77M | 492.77M | 492.77M | 492.77M | 493.51M | 551.54M | |||||||||||||
| Diluted Share Outstanding | 492.77M | 492.77M | 492.77M | 492.77M | 493.51M | 551.54M | |||||||||||||